
Reports Tool
Plan Requirement: Basic and up — each report has its own plan requirement
Reports & Tools is where you answer a question about your shop: how sales are tracking, what stock is sitting, who owes you money, what changed and who changed it.
Finding a Report
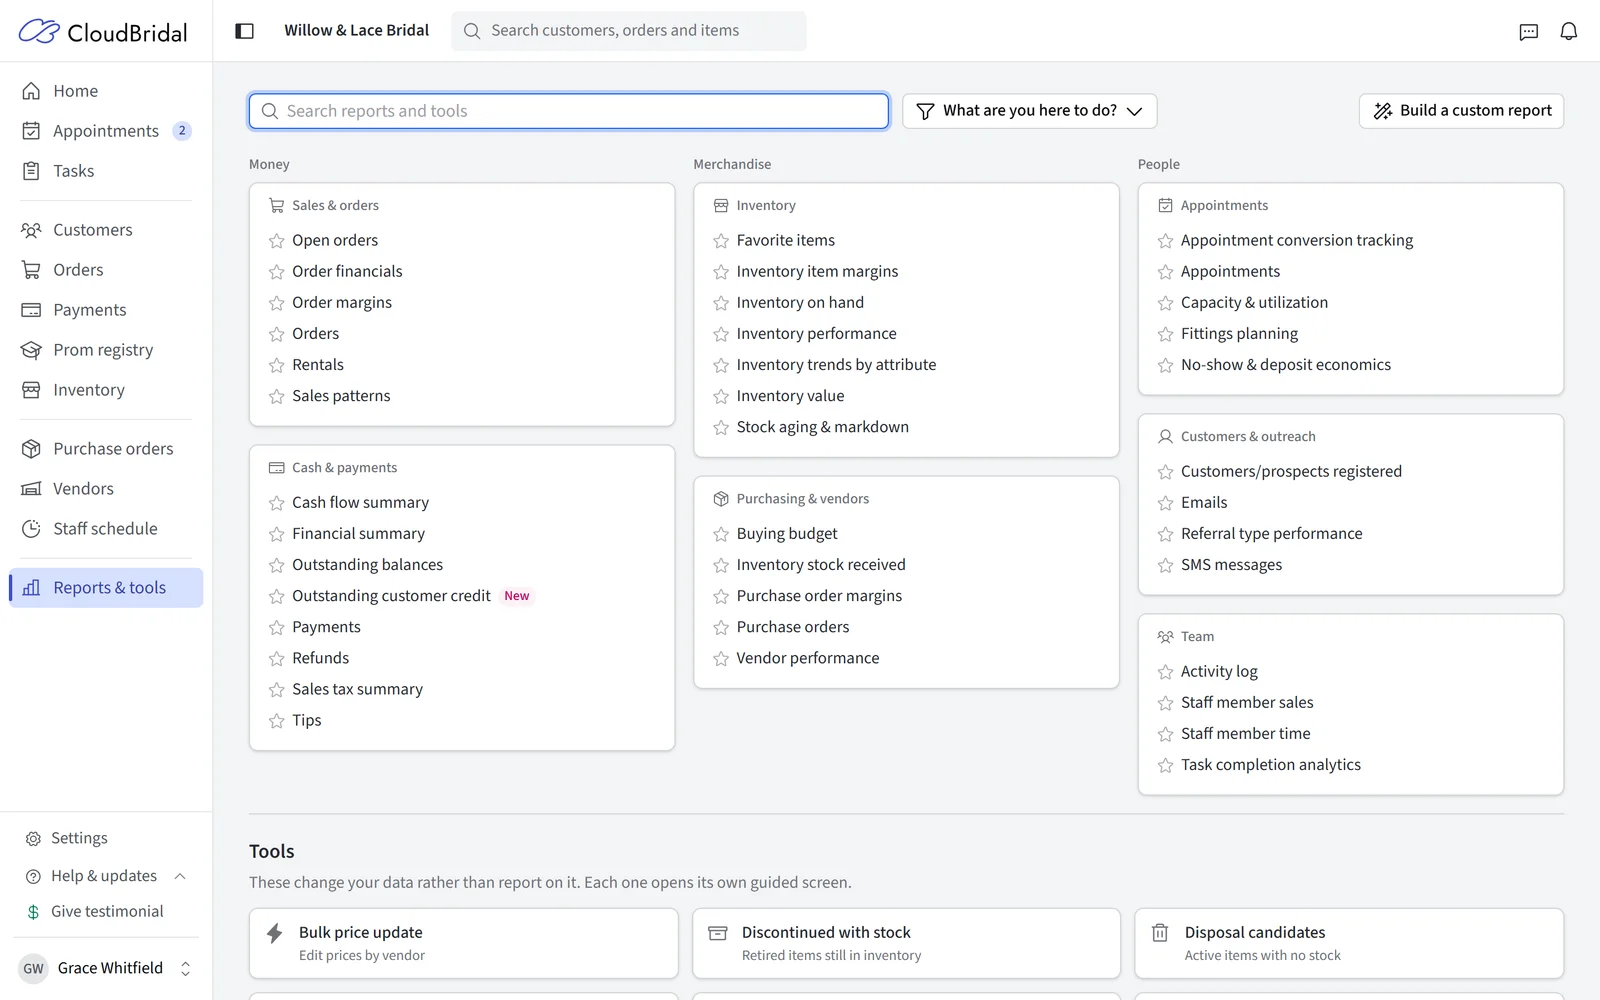
The catalog files every report under three columns:
- Money — Sales & orders, Cash & payments
- Merchandise — Inventory, Purchasing & vendors
- People — Appointments, Customers & outreach, Team
Ways to narrow it down:
- What are you here to do? — pick the job you sat down to do (closing the month, buying at market, clearing old stock, and so on) and the catalog shows only the reports that sitting calls for.
- Search — matches report and tool names and descriptions, plus alternative names you might know them by ("dead stock", "stocktake", "open to buy").
- Favorites — star a report to pin it to the top.
- Tools — a section below the catalog for tools that change your data rather than report on it: the inventory tools (Physical count, Slow movers, Disposal candidates, Discontinued with stock, Missing wholesale prices, Bulk price update) and Import from a spreadsheet for items, customers or appointments.
A report your plan or role doesn't cover stays listed with a lock and the reason, so you can always see what exists. Only reports for features you don't use are hidden.
Running a Report
- Pick a report.
- Set the date range — use a quick pick (Today, This Week, This Month, This Year, or their "Last" equivalents) or enter your own dates. Some reports are a snapshot of right now and have no date range.
- Set any filters the report offers.
- Click View report.
From the results you can:
- Arrange the output — choose which columns show, reorder them, sort, and group. Available on every plan.
- Export to Excel for further analysis, or print for a meeting or your records. A few of the analysis reports are on-screen only.
- Drill down — click a figure to open the orders, appointments or items behind it.
Saved Custom Reports
Once a report is arranged the way you want it, click Save to keep it as a named custom report. Saved reports appear alongside the base reports in the catalog, and you can save several versions of the same report for different purposes.
Saving custom reports requires the Ultimate plan.
Limiting a Role to Certain Reports
By default anyone who can run reports sees every report their plan includes. To narrow a role, open it in Settings › Staff members, set Run reports to some reports, and choose the reports that role can run. Reports added to CloudBridal later aren't included until you add them. Administrators are never limited.
Across Your Stores
Beta — shown only when your store is linked to other stores.
These reports run in the stores you tick under Stores and put them side by side. They're listed first, in an Across your stores section; everything below it, under This store, runs in the store you're signed into.
- Sales by store (Basic) — orders, net sales and each store's share, tax and average order. Each store's figures match its own Financial summary.
- Staff sales across stores (Core) — every store's staff in one table, with item type and customer type breakdowns.
- Cash flow by store (Core) — payments received and refunds issued, by store and combined.
- Sales tax by store (Basic) — each store's sales tax summary, with the tax collected across your stores.
- Inventory value across stores (Core) — what your stock cost and what it's worth at sale price, by store and item type.
- Appointment conversion by store (Core) — how many customers bought after an appointment, store by store and combined.
Which stores are included:
- A linked store is included when it's active, your login has access there, and your role there can run the matching single-store report (for example, Cash flow summary for Cash flow by store).
- If your login can't get into a linked store, the section names it. An admin of either store can give you access in Settings › Stores.
- Combined totals appear only when every chosen store uses the same currency.
- Excel exports leave out the side-by-side comparison grids.
Sales & Orders
- Orders lists customer orders in your timeframe, with multi-item orders broken out as separate lines. Filter by date type (sale, ordered, arrival, and more), staff member, order status, item type and customer type.
- Order financials adds the money to that listing — gross, net, tax, totals, remaining balance, and payments both overall and within the date range.
- Order margins shows profit per order by comparing sale price to cost. Both reports carry a Wholesale cost column (catalog wholesale price × quantity) with a footer total.
- Open orders groups everything not yet complete by status, with aging and item-level detail, so you can see where work is stuck.
- Sales patterns shows how sales fall by day of week, month and item type.
- Rentals tracks rental orders with rental status, due dates and returns, when the Rentals feature is enabled.
Cash & Payments
- Payments lists customer payments with totals, subtotals and tax, filtered by payment date or creation date and by status.
- Refunds documents refunds issued, including surcharge and tip amounts refunded.
- Tips breaks gratuities down by staff member with counts, totals and averages, when tip tracking is enabled.
- Cash flow summary shows net cash flow as a waterfall — payments, tips and surcharges in, refunds out, net at the bottom — broken down by payment method, month, item type, customer type and sales associate.
- Sales tax summary breaks tax collected down by rate, with a choice of reporting basis (order date of sale, order completed date, or payment basis). See Sales Tax Reporting for guidance on choosing the right basis.
- Financial summary is the period at a glance — sales, payments, refunds, adjustments and tips together, with sales grouped by item type, order status, staff member and customer type. For payment-method detail see Cash flow summary; for filing splits see Sales tax summary.
- Outstanding balances shows who owes you money right now — customers with the largest balance first, each with their orders oldest first. Each order's Event Date appears alongside its order date, in the table and in the export.
- Outstanding customer credit is the other side: customers holding credit right now — money paid but not yet applied to an order — with how old the oldest credit is and the payments behind it. Open a customer to apply their credit, or click the payment count to review those payments. It's a snapshot, so there's no date range.
Inventory
- Inventory on hand is a snapshot of current stock with cost and sale price valuations. Filter by vendor, item type, customer type, item status (Active, Discontinued, Disposed) and stock — In stock or Out of stock, defaulting to In Stock — and optionally narrow to items added in a date range. For the value of your stock on a past date, use Inventory value.
- Inventory performance ranks items by how often they sell, best first. Items with no sales are excluded.
- Inventory item margins shows wholesale price, effective retail price, margin and markup for stocked items. Variants with no costed stock show blank rather than a margin.
- Inventory trends by attribute analyzes sales by item characteristics such as color or size — useful ahead of buying.
- Inventory value totals cost and sale value of your stock as of a date (from December 31, 2025 onward), broken down by item type, for insurance valuations and planning. Sale value uses each item's sale price. If a price or quantity looks mistyped — far above the rest of your price range, or more than 500 on hand — the report still includes it but lists it, with how much of the total it accounts for, so you can correct the item.
- Favorite items shows which items customers favorite most through your inventory showcase, and how those favorites convert to sales.
Stock Aging & Markdown
Plan Requirement: Ultimate
Groups every unit on hand by how long it has been in the shop — under 12 months, 12–17, 18–23, 24–35, and 36+ — with retail and cost value, when the style last sold, and the markdown typical at that age. It's a snapshot, so there's no date range; filter by vendor and item type.
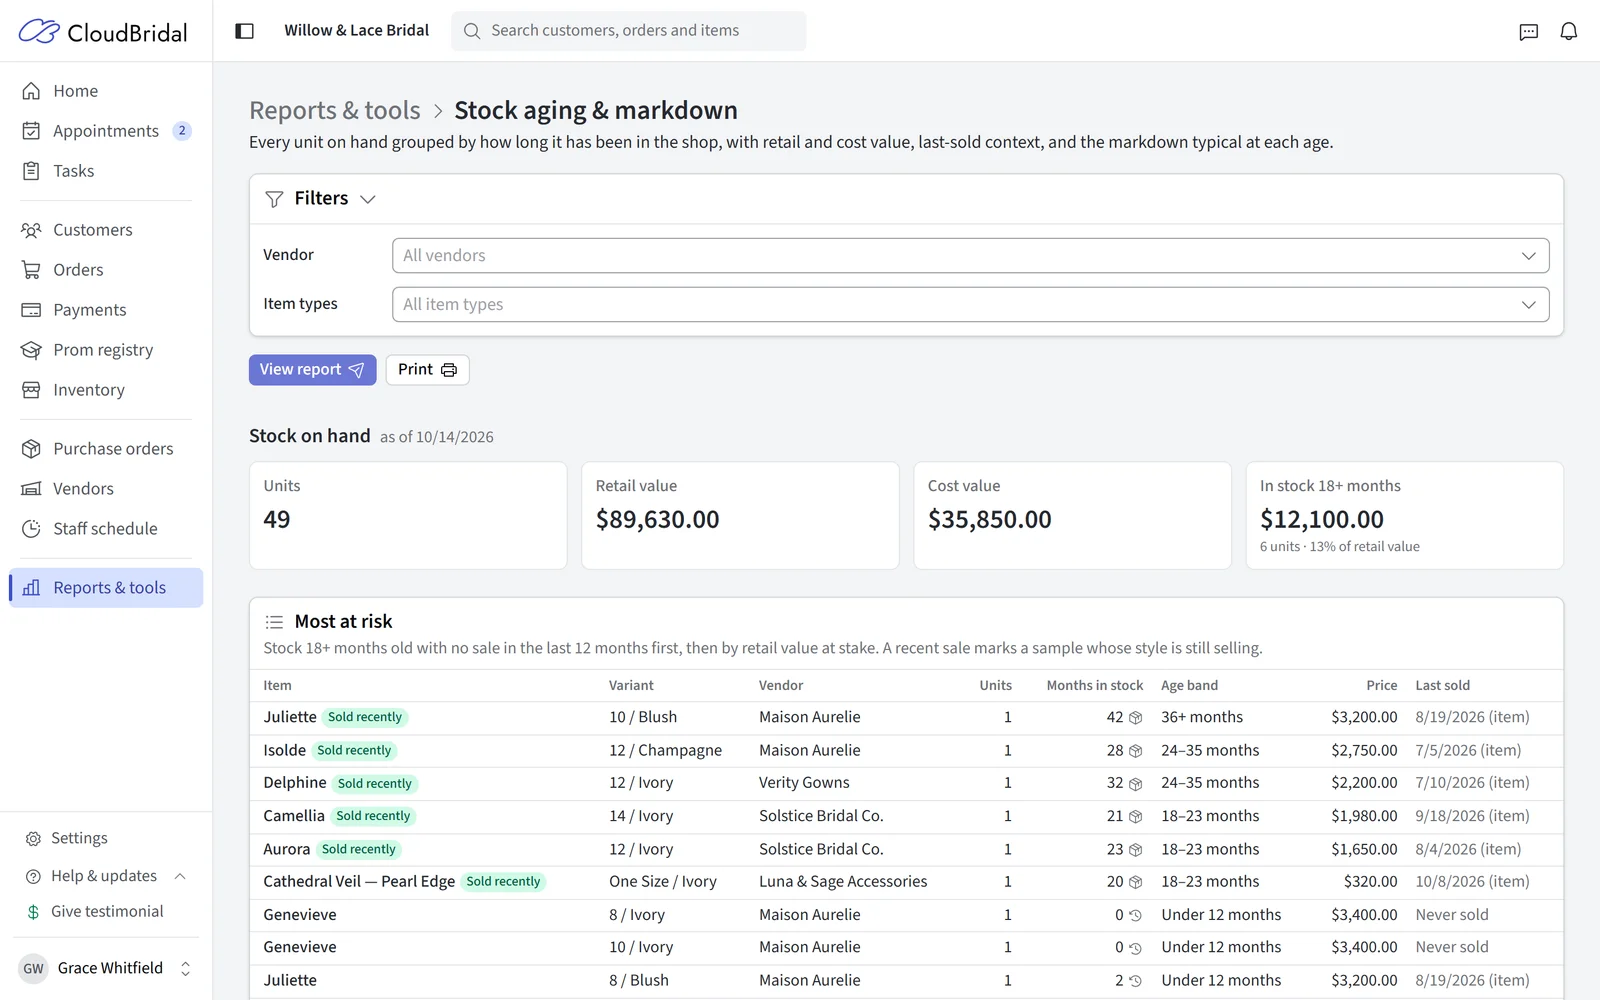
- Stock is flagged at risk when it has been in the shop 18 months or more with no qualifying sale in the last 12 months.
- The typical markdown shown for each band is reference data, not a recommendation for your shop.
- Click an age band, or the "never sold" figure, to open that band's full population. Inside, a markdown slider shows what those rows would list at — computed off the ticket price, and never raising a price that is already lower.
For a working list you can act on item by item, use the Slow movers tool, which applies the same at-risk rule.
Purchasing & Vendors
- Purchase orders lists vendor purchase orders with status, costs and expected delivery. Filter by creation, update, ordered and arrival dates, and by type (Customer or Stock); drafts and cancelled orders are excluded by default.
- Purchase order margins compares what you actually paid the vendor, including additional fees, against what the customer paid.
- Inventory stock received tracks individual stock units received from vendors, with receipt dates and costs.
- Vendor performance compares vendors on sales volume, retail and wholesale value, markup and discounts. Wholesale figures are estimated from catalog prices — for what you actually paid on special orders, use Purchase order margins.
Buying Budget
Plan Requirement: Ultimate
How much you can afford to spend on stock in an upcoming window: the retail value that will leave your rack, less the stock you already hold and what's already on order. Choose a planning window (3 or 6 months) instead of a date range, and optionally narrow to particular item types.
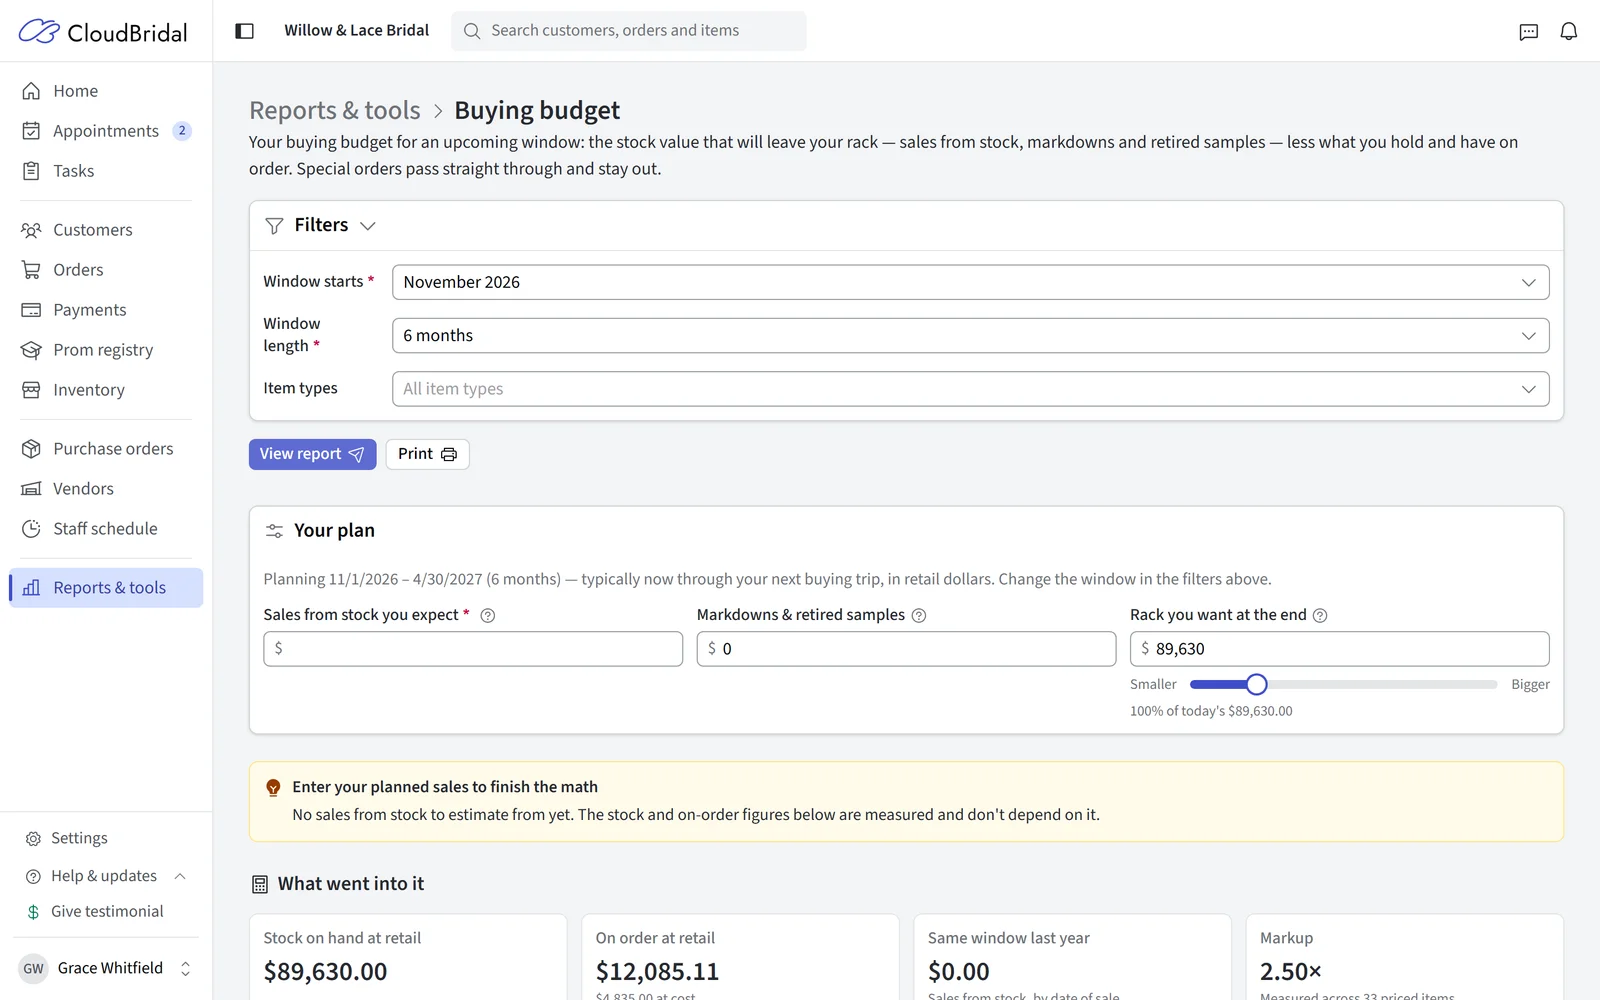
- Special orders stay out of the math on both sides. The designer makes each one for a single bride and it leaves with her, so it never changes what's on your rack — its sale doesn't count toward planned sales, and its purchase order doesn't count as on order. Alterations, extra work and fees are left out too.
- Sales from stock, markdowns & retired samples, and the rack you want at the end are filled in for you from your history and today's stock. Markdowns & retired samples covers the discount when stock sells below its ticket, plus the full ticket of anything given away free and of samples you retire, donate or write off with the disposal tools. Each has a dial against your usual. Beneath them, two bars balance: the space the window opens on your rack (what sells, markdowns and retirements, plus any growth) and what fills it (what's already on order, plus your room to buy). To grow your stock, set the rack you want above today's.
- Your rack is valued at each item's full retail price, even when it's marked down, the same way markdowns are measured — so a markdown counts once, when the item leaves the rack. That's why the rack figure can be higher than the sale value in Inventory value.
- Samples retired before July 20, 2026 weren't recorded, so until your history reaches past that date the retired-samples part of the default may be low — add any you know about.
- Purchase orders still open after more than 12 months are flagged, since they inflate your on-order commitment without ever arriving.
- On-screen only — there's no Excel export.
Appointments
Available when the Appointments feature is enabled.
- Appointments lists appointments with status, type, staff and room, and when each was booked (Booked on). Group by room, appointment type or staff member to see volume by any of those; filter by tags, visit stage and more. Set Date field to Booked on to report on appointments booked in a period rather than held in it.
- Appointment conversion tracking shows how effectively appointments turn into sales, broken down by appointment type, customer type, staff member and referral source. Click any metric to drill into the appointments or orders behind it. See Sales Conversion Tracking for how orders are attributed to appointments.
- Fittings planning finds customers by event date so you can plan upcoming fittings and follow-up appointments.
- Capacity & utilization (Ultimate) measures how much of your appointment capacity you actually book, by day of week, room and hour, with close-rate context. Defaults to the last 90 days; the range ends yesterday and can cover up to a year. Filter by room. On-screen only.
- No-show & deposit economics (Ultimate) shows how often appointments don't happen, what that costs at your own close rate and average sale, and how your fee-bearing appointment types compare with your free ones. Defaults to the last 365 days. Because the numbers depend on staff marking no-shows, the report first tells you how consistently your shop marks them, and warns you when there isn't enough history to trust the figures. On-screen only.
Customers & Outreach
- Customers/prospects registered lists customers and prospects added in your timeframe with contact and registration details, plus their orders and payments. Filter by created, updated, event or staff association date, by customer type, and by customer versus prospect.
- Emails lists emails sent to customers and prospects, with delivery status.
- SMS messages shows text messages sent and received between your store and your customers.
- Referral type performance shows which marketing channels bring in your best customers, optionally filtered by item type.
Team
- Staff member sales gives per-person sales figures — item sales excluding services, net sales including services, and totals including tax. Group by customer type or item type. A sale split between staff members is credited by percentage — a 50/50 sale gives each person half the revenue and 0.5 under Credited sales — here and in Appointment conversion tracking, Financial summary, Tips and Cash flow summary. Filtering by a staff member includes sales they were on the split for. Sales with nobody assigned, or credited to someone no longer on staff, share one (No associate) row.
- Sales goals (Core and up): people who can see goals get Goal and Of goal columns and a Team goal tile, prorated by day for dates that aren't whole months. See Sales Goals.
- Staff member time combines scheduling and time tracking, showing scheduled, worked, break and effective hours with wage calculations. Expand a row to see individual shifts; filter by shift status (Complete, Incomplete, Scheduled, Removed).
- Task completion analytics tracks completion rates, overdue tasks and each staff member's assignments.
Activity Log
Plan Requirement: Core or Ultimate
Every recorded change and customer note in a period: what changed, who changed it, and when. This is what answers "who discounted this order" or "when did this status change".
- Defaults to the last 30 days and covers up to 60 days at a time.
- Filter by what changed (record types, plus customer notes), by team member — choose System for changes CloudBridal made on its own — and by specific fields, such as only price or status changes.
- Requires the See the audit log permission on top of running reports. Without it the report stays listed with a note that an admin can grant it in Settings › Staff members.
- Roles that hide wholesale prices don't see cost figures here either.
Updated on: 19/10/2026
Thank you!